Essential Features of a Financial Dashboard
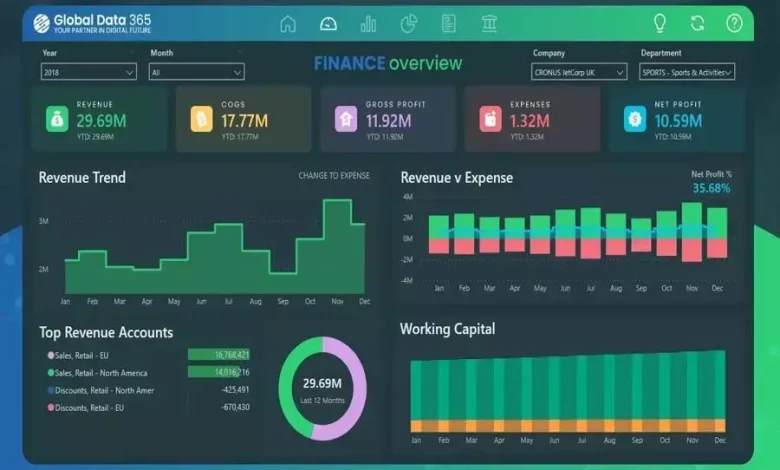
In this data-hungry modern world of business, immediate access to accurate financial data has become more important than ever to make good decisions as quickly as possible. A financial dashboard is a graphical presentation of a company’s relevant financial indicators and performance metrics that will allow stakeholders to instantly monitor the company’s financial health. A well-designed financial dashboard transforms complex data into accurate useful information, and business owners, executives and finance professionals can observe trends, recognize opportunities and make adjustments before they become crises. The right financial dashboard will provide a way to streamline financial reporting processes and make financial management much easier for organizations.
A defining capability of the modern financial dashboard, perhaps its most valuable function, is that it promises current information about an organization’s financial situation. The dashboard can present cash flow, accounts receivable, accounts payable and all other important numbers as they change minute by minute, not just retrospectively for a given month or quarter. In this sense, the real-time feature keeps decision makers constantly connected to the latest financial data on the industry, so they can react immediately to changing market conditions or emerging financial problems.
The immediate nature of financial dashboards promotes proactive management rather than reactive action. For example, when cash balances start trending downward for unusual reasons, instead of finding out weeks later through checking monthly reports, the executive in charge of finance can investigate and rectify the situation. This redefines the way organizations handle their finances and allows for more agile decision-making company-wide.
Key Performance Indicators Available Individually
Since every organization has specific financial goals and priorities, customization is one of the most prominent features of a good financial dashboard. It allows organizations to select and display only the key performance indicators (KPIs) relevant to a specific business goal, allowing them to focus on the measures most critical to their success. Although some primary financial metrics such as revenue or costs, as well as profit margins, are universal, others can vary greatly according to industry or business model or organization-specific goals.
Cash flow is the lifeblood of any company, and it is one of the most important components of a financial dashboard. Good cash flow tracking features should display the current balance of all cash accounts, recent expenditures and receipts, and projected future cash availability based on forecasted payables and receivables. By gathering this information in a financial dashboard, businesses can best maintain their cash levels, be confident that they can meet financial obligations, and avoid cash shortages that can slow down operations.
An advanced financial dashboard can also include cash flow forecasting features that draw on historical trends and expected future transactions to estimate the cash position for the next few weeks or months. This cash forecasting capability allows finance departments to plan in advance for periods of potential cash shortages or visualize opportunities to invest excess cash at a better return. The presentation of cash flow trends on a financial dashboard makes it much easier to identify trends that are not visible when looking at traditional financial reports.
Budget vs. Actual Comparison
Creating a budget is the core of financial planning, but a budget only works when actual performance is measured against it on a regular basis. A financial dashboard should have simple visual comparisons between budget amounts and actuals by various financial categories. The comparisons allow organizations to track whether they are staying within planned spending levels and achieving revenue objectives.
Once budget and actual variances are identified in a financial dashboard, finance departments can dig deeper to understand why it happened and respond appropriately. For example, if the money spent by the marketing expense department is far in excess of its budget, the manager can figure out whether this is an approved strategic expenditure or a wasteful spending issue. The visual nature of these comparisons on a financial dashboard makes such variances obvious at a glance, increasing budget compliance and financial conservatism.